One Health Newsletter
Using NASA Satellite Data to Examine Environmental Health Risks
Author
Shay Nair Sharma
As our planet endures the effects of climate change, the global community will be potentially exposed to a changing array of infectious diseases, environmental health, and air quality threats. Changing land use and climate patterns shift terrestrial, aquatic, and atmospheric ecosystems, altering interactions between humans, plants, and animals, and creating new health risks. The World Health Organization (WHO) has emphasized the importance of actively monitoring health risks and the urgent need for technological solutions to address these growing global health challenges.
The National Aeronautics and Space Administration (NASA), an independent agency of the U.S. federal government responsible for the civil space program, aeronautics research, and space research, employs Earth-observing satellites that collect temporal and spatial information about dynamic environmental parameters. This article highlights three environmental health applications, and One Health-related application – algal blooms, vector-borne diseases, and wildfires. Information from satellite data plays an integral role in forecasting health risks and enhances our understanding of how changing ecosystems affect public health.
Improving Forecasts of Respiratory Illness Hazard
Karenia brevis (a marine dinoflagellate) can accumulate into blooms (called “red tide”) and affect the marine ecosystem of the Gulf of Mexico, spreading a neurotoxic toxin into the shellfish that humans and animals can ingest and/or inhale when aerosolized.1 To address this environmental risk, the National Oceanic and Atmospheric Administration (NOAA) team developed a regular forecast (twice every week) of these algal blooms in 2004, to update coastal residents on when and where these blooms would pose the highest health risk. However, since bloom severity varies from beach to beach and from hour to hour, NOAA created an hourly forecast to address this concern.
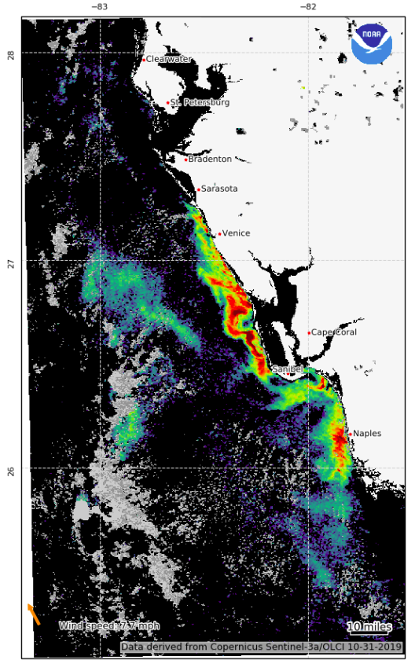
To examine the presence of harmful algal blooms, the NOAA research team, led by Dr. Richard Stumpf, developed the HABscope, a low-cost portable mobile phone-mounted microscope system that utilizes video and artificial intelligence to quickly analyze coastal water samples for near real-time K. brevis cell counts.2 Counting on the help of “citizen scientists” (volunteers trained with the HABscope) and partnering with the Florida Fish and Wildlife Conservation Commission and the Gulf of Mexico Coastal Ocean Observing System, the team integrated HABscope smartphone app data with chlorophyll fluorescence satellite data from the Ocean Land Colour Imager (OLCI) and the Moderate Resolution Imaging Spectroradiometer (MODIS) instruments, to monitor the presence and extent of harmful algal blooms along the Florida beaches in the Gulf of Mexico. Building upon the original NOAA forecast, the 24-hour Red Tide Respiratory Forecast (updated every three hours) offered a higher resolution forecast of affected Florida beaches along the Gulf Coast, allowing beach communities to better understand the risk and take appropriate precautions (see Figure 1).
Algal blooms are not only a problem for the Gulf Coast – they occur globally. NOAA continues to combine multiple data sources and engage citizen volunteers to improve forecast resolution and inform people which beaches, and at which times, may be safe to use. Dr. Stumpf, who has already spearheaded the expansion of the forecast coverage to the Gulf of Maine and Lake Erie, stated, “We aim to provide data for the whole coast of the country that is useful for managers and people that are responding to these issues. Our goal is the country.”

Figure 1: Hourly Red Tide Location for Florida’s Gulf Coast (Area)
A color-coded map indicating respiratory risk levels from algal blooms along Florida's Gulf Coast. Red signifies high risk for all individuals, with those suffering from lung disease advised to avoid the area. Orange indicates moderate risk, with similar recommendations for avoidance. Yellow denotes low risk, suggesting caution for those with lung conditions, and Blue represents very low risk, where individuals with lung disease should leave if symptoms develop. Source: NOAA
Enhancing Decision Support for Highly Invasive Vectors
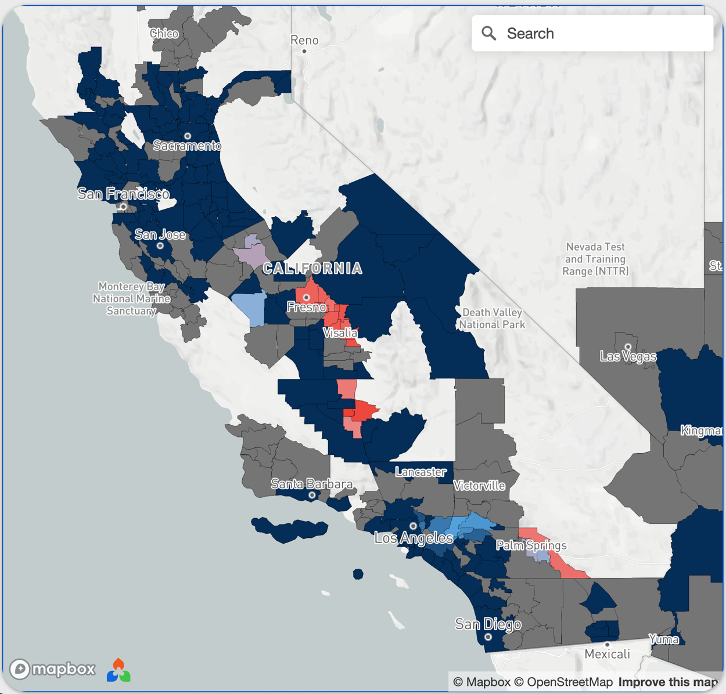
Aedes aegypti and Aedes albopictus are two common invasive mosquito species in the continental United States, largely responsible for transmitting dengue and chikungunya viruses.3 Viral spread can be mitigated by knowing the spatial and temporal prevalence of these mosquitoes. Understanding the link between habitat conditions and mosquito populations would allow public health agencies to notify the public to take precautions during high mosquito activity and ultimately reduce vector-borne disease transmission risk. A collaboration between the research team from the University of California at Davis led by Dr. Christopher Barker, the Mosquito and Vector Control Association of California, and the California Department of Public Health developed a real-time risk map for invasive mosquitoes and arboviruses (see Figure 2).
In this research, these institutions integrated the rich surveillance data from mosquito control partners with temperature data from NASA’s Terrestrial Observation and Prediction System (TOPS), North American Land Data Assimilation System (NLDAS), Moderate Resolution Imaging Spectroradiometer (MODIS), and Visible Infrared Imaging Radiometer Suite (VIIRS) to develop models and maps for (1) suitability for the mosquitoes that transmit dengue and Zika viruses and (2) risk for dengue and Zika transmission. The latest surveillance data are visually displayed as maps in the Vector-borne Disease Surveillance System.
Following their successful implementation in California, the team has expanded its work to 21 U.S. states and territories. As Dr. Barker stated, “Once you have done one state, you can do 50 states. We are trying to help states be able to use their data as quickly as possible.” Since 2013, the team has continued its mission to reduce vector-borne disease transmission and proactively prevent outbreaks, by partnering with mosquito control and public health agencies around the country and recently expanding their data system to include tick-borne pathogen monitoring.

Figure 2: Dengue and Zika Risk Weekly Forecast
A relative risk map showing the likelihood of additional locally transmitted dengue infections following the introduction of an initial case. Red highlights moderate risk, pink shows low risk, light blue indicates very low risk, and dark blue represents extremely low risk. Source: NASA/Barker
Assessing and Predicting Wildfire Smoke-Related Morbidity
Wildfires are a growing public health threat in the western United States. Wildfire smoke plumes and their particulate matter (PM) are associated with various downstream health consequences. The PM risk is critical information that helps health departments formulate effective prevention and control programs within their localities.
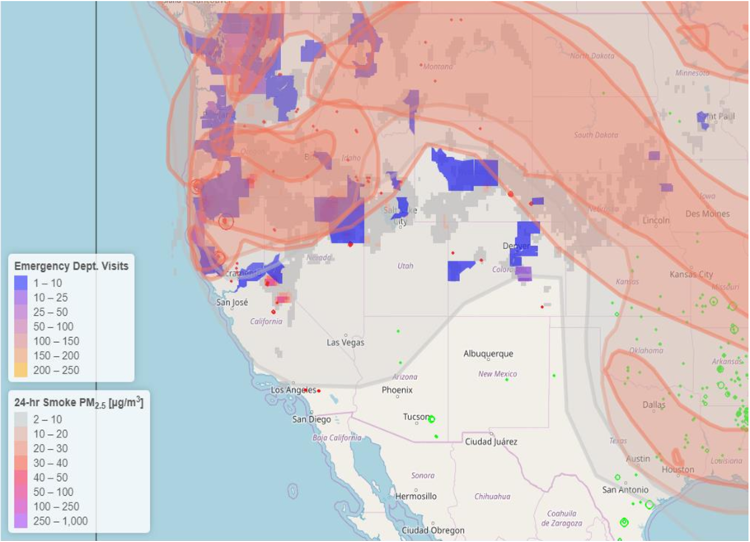
At Colorado State University, a research team led by Dr. Jeffrey Pierce investigated the link between NASA’s MODIS aerosol optical depth PM exposure data, data from models, surface monitors of PM, and health surveillance data from the 2010-2015 fire seasons in Washington, Colorado, and Oregon.4 In partnership with the Washington State Department of Health Comprehensive Hospital Abstract Reporting System, the Colorado Department of Public Health and the Environment, and the Oregon Office of Health Analytics, they examined data on hospital admissions and respiratory and cardiovascular patient outcomes. These findings were used to develop a Smoke Health Impact Assessment Forecaster tool, which aims to predict real-time PM exposure and health risks (see Figure 3).
At present, the team is working with various agencies across the country, including the Kansas Department of Health and Environment and the New Mexico Department of Health, to aid them with their smoke decision-making activities. According to Pierce, their current research is to determine how satellites can assist rural communities that the Environmental Protection Agency cannot monitor.

Figure 3: Smoke Health Impact Assessment Daily Forecaster Tool with Emergency Department Visit Predictions
Map showing 24-hour smoke PM2.5 concentrations (μg/m³) and corresponding emergency department visits due to smoke exposure across the western U.S. The map uses different colors to represent varying levels of PM2.5 and the number of emergency visits, providing a visual overview of smoke-related health impacts in different regions. Source: NASA/Pierce
Action Steps
As the One Health community refines its approaches to studying emerging global health risks to environmental components more closely, maximizing the use of NASA satellite data can be helpful in decision-making activities toward prevention and control. Specifically, three action steps can help engage our community, build upon the knowledge base, and promote multidisciplinary collaborations across sectors and geographies.
- Learn: Gain insight into how remote sensing data and products can help your discipline. NASA offers many educational resources, including the Applied Remote Sensing Training Program (ARSET), a free self-paced online training program that provides hands-on techniques for downloading and analyzing data.5 Notably, the Fundamentals of Remote Sensing and An Inside Look at How NASA Measures Air Pollution courses can serve as first steps to learn more about remote sensing and air pollution.6,7
- Collaborate: Join an organization or a community of practice to contribute your expertise and expand your networks. For example, the American Public Health Association’s One Health Section offers opportunities to learn from colleagues, expand networking, and gain leadership skills. Also, the Group on Earth Observations (GEO) Health Community of Practice represents a global community that uses environmental observations to improve health decision-making at the local, regional, and international levels.8 The team supports five work groups and coordinates bimonthly meetings to discuss diverse approaches to using Earth observations in public health applications (heat, infectious diseases, air quality, food security and safety, health care infrastructure).
- Teach: Reach out to colleagues outside your field to share your perspective and promote innovation at the intersection of diverse disciplines. Lead a webinar at the institution's School of Health Sciences and share information about how discipline can connect with the One Health community. For educational purposes, NASA has prepared health graphics as well as interactive educational resources like NASA TV and the Earth Information Center.9, 10, 11 Connect with Earth scientists to explain how the environmental factors connect with health from your “on the ground” perspective.
With satellite remote sensing, we have the potential to detect early cues of climate change, enabling us to anticipate and prepare for public health threats. Whether algal blooms, vector-borne diseases, or wildfire smoke, scientists can use these invaluable environmental data to formulate comprehensive strategies to mitigate its adverse impacts. By learning more about geospatial data applications, fostering collaborations between public health professionals and Earth scientists to enhance predictive modeling, and raising awareness about the interconnectedness of our planet and its living organisms, the One Health community can play a pivotal role in anticipating and mitigating health challenges caused by climate change. The implementation of these proactive strategies will help us stay ahead of global health challenges for the well-being of our planet and its population.
References
- Pierce RH, Henry MS. Harmful algal toxins of the Florida red tide (Karenia brevis): natural chemical stressors in South Florida coastal ecosystems. Ecotoxicology. 2008;17(7):623-631.
- Hardison DR, Holland WC, Currier RD, et al. HAB scope: a tool for use by citizen scientists to facilitate early warning of respiratory irritation caused by toxic blooms of Karenia brevis. PLoS One. 2019;14(6): e0218489.
- Kraemer MUG, Sinka ME, Duda KA, et al. The global compendium of Aedes aegypti and Aedes albopictus occurrence. Scientific Data. 2015; e2:150035.
- Gan RW, Ford B, Lassman W, et al. Comparison of wildfire smoke estimation methods and associations with cardiopulmonary-related hospital admissions. GEO Health. 2017;1(3):122-136.
- NASA Applied Sciences Program. Applied Remote Sensing Training Program (ARSET). Accessed September 2024. https://appliedsciences.nasa.gov/what-we-do/capacity-building/arset.
- NASA Applied Sciences Program. ARSET - Fundamentals of Remote Sensing Training Program. Accessed September 29, 2024. https://appliedsciences.nasa.gov/get-involved/training/english/arset-fundamentals-remote-sensing.
- NASA Applied Remote Sensing Training Program (ARSET). ARSET - An Inside Look at How NASA Measures Air Pollution. Accessed September 2024. https://appliedsciences.nasa.gov/get-involved/training/english/arset-inside-look-how-nasa-measures-air-pollution.
- Group on Earth Observations (GEO) Health Community of Practice. CoP. Accessed September 2024. http://www.geohealthcop.org.
- NASA Applied Sciences Program. Health and Air Quality. Accessed September 2024. https://appliedsciences.nasa.gov/what-we-do/health-air-quality.
- NASA. NASA live TV. Accessed September 2024. https://www.nasa.gov/live/.
- Earth Information Center. Explore our Changing Planet. 2024. Accessed September 2024. https://earth.gov/.
Contact Us